Expanding sphere of work includes the wind survey of the world Dorothy – 16/06/03
Heavy load of teaching and research In the 1980s Neil was a Senior Lecturer in Agricultural Meteorology at Lincoln University, teaching first, second and third year students, and supervising graduate students – carrying close to 1.85 times the average load of a senior lecturer – and he was also responsible for the Wind Energy Project.
Research into heat loss from lambs At this time Neil began his research into heat loss from lambs. The lambs were called Bruce because he had a technician called Paul Garvin who used to call all the lambs Bruce as they did their testing. They made up a little aluminium cylinder, put a lamb’s fleece on it and a light bulb in it and then had a feedback circuit to keep the temperature constant. This enabled them to work out how much heat loss there was under various weather conditions.
This inventiveness was typical of the sort of research Neil often did and is reminiscent of the balloons he made of plastic and sellotape during his PhD research. To study hypothermia in lambs they made the lamb with a light bulb as its metabolism, with wooden legs – as close to a lamb as they could make it. When they wanted to look at the animals up around the Port Hills, in winter the area was snowed up and they could get there in a four wheel drive, but in spring and in autumn it was so wet that they could not get up there. Neil called up the NZRAF and asked if they had a helicopter with which they could do an exercise over Banks Peninsula. They agreed to help and would go to Lincoln, pick up Neil and Paul and take them to the various sites, and would hover with one of their skids on a rock while they took the measurements of the wind speeds on the anemometer on top of 10 metre towers on Herbert Peak, Quail Island spit, Marleys Hill, Sugarloaf, Godley Head, Mount Pleasant, and down in Gebbies Pass.
An exercise in cooperation – before User Pays! They were cooperating with the broadcasting people who had anemometers on Sugarloaf, with the Post Office, the Ministry of Works, and the local farmers.
Once they had permission from the farmer to install the anemometer, in the Rakaia Gorge for instance, they would need to call up ECNZ, who when they were going in that direction would put an extra pole on the truck, go in with an auger, drill a hole, put the pole in and call Neil or Paul at Lincoln to say that it was done. Paul would go up with a pipe and put an anemometer on it.
The calculator would count the turns of the anemometer and the researchers at Lincoln would get a reading once a day, or more often if it was windy.
This was a highly cooperative programme including the armed forces. They saw it as a very useful training exercise and it would also fulfil the researchers’ need to have the charts changed every month.
The Met Service were very supportive and allowed Neil to photocopy all the records of wind frequency distributions for every month, for every season and for every site. That cost about 5 cents a page. About five or ten years later it was five cents a number in terms of User Pays! This applied until the Commerce Commission said that these are numbers collected by the tax payer, so they should be free to the tax payer.
Once User Pays came in all that cooperation stopped.
Effect of the Internet With the Internet it is now possible to get satellite pictures and radar pictures free on the Internet because the Commerce Commission has said that that must happen because the taxpayer has paid for them. The Minister of Transport and Met Service, Bill Jeffries, told Neil that in Britain they had a centre where relevant information came in from all around the world, including New Zealand. Information costs them nothing because they analyse the data, do the forecasts and send them back to the country which supplied the data – a cooperative exercise. Mr Jeffries was astonished as he was a Minister in the Government that brought in User Pays.
Meteorology the global common Neil commented, “That is how it should be because meteorology is termed the global common where information should be freely shared. The weather belongs to everybody. All we do is study it, record it and do what we can to forecast it for the average person.”
The phrase, global common, came to Neil from the Director of the Met Service years ago when, along with Blair Fitzharris of Otago, Neil was regarded as the major meteorologists external to the Met Service. They were brought in on a lot of discussions and asked for advice.
Wind energy advisory committee of Electricity Corporation of New Zealand (ECNZ) ECNZ invited Neil to be part of their wind energy advisory committee because of his work on wind energy. They bought the wind turbine up at Brooklands in Wellington. That led to his becoming part of the climate advisory group of ECNZ.
The Met Service had forecast that there was going to be an El Nino in 1991 and the media went to Neil as they usually did, and said, “The Met Service have forecast that there is going to be an El Nino. Is there going to be one?”
When Neil answered, “Yes”, the response was, “Oh, damn!”
“But it’s going to be a long-lived one, according to our understanding,” Neil added.
“Oh, great!” was the ironic response.
So it went on the National News that the Met Service was forecasting an El Nino, but Neil had forecast a long-lived El Nino. Neil had based his forecast on the time in 1975-6 when the Quasi-biennial Oscillation and the Southern Oscillation were in exactly the same position and that caused a long-lived El Nino.
Research into hydro flows for ECNZ When Neil was in Wellington at a meeting of the Wind Turbine Advisory Group he was asked about the basis for his prophecy. When he explained it they asked him to do some work on hydro inflows and how these various parameters relate to what you are talking about in relation to El Nino. As a result Neil got a contract to develop an analysis of the hydro flows. This, as Gae pointed out, was on top of the 1.85 work load. However, out of that Neil developed one of the most advanced forecasting models for hydro inflows and there was a long-lived El Nino which was part of the 1992 power crisis along with the Pinatubo eruption. He learnt later that the reason that ECNZ’s Generation Manager was worried about the El Nino was that the previous power crisis was during the El Nino in 1975-6.
Experience in giving evidence at hearings This was followed by the power crisis and the Power Crisis Enquiry at which Neil gave evidence. He had been invited earlier to give evidence on alternative energy at the Royal Commission on Nuclear Power so he was used to cross-examination under those circumstances. Since then he has given evidence as a meteorologist and scientist in many other hearings.
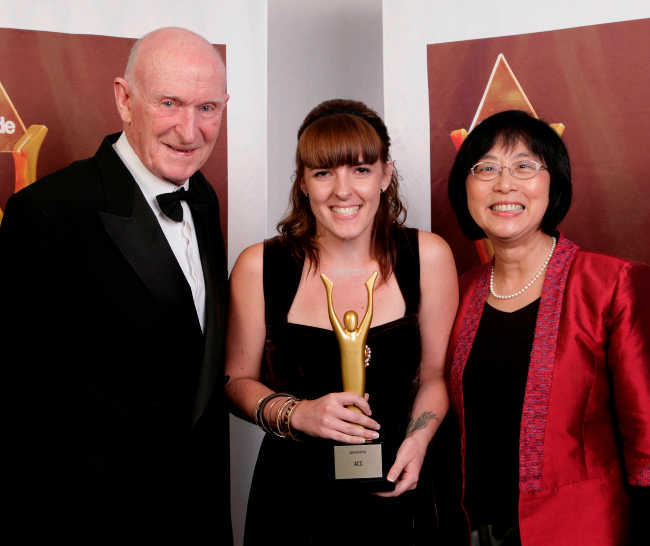
Golden Key Award for expressing the truth in science “I have become used to the idea that when I am attacked it is not a personal attack but an attack on the way I am defending a position,” Neil said in 2003. “I now have a reputation in New Zealand and around the world for giving independent evidence. Most recently I gave evidence at a Senate inquiry in Australia on electromagnetic radiation and health effects. The senator who was chairing that hearing went to a conference the week afterwards and said that there was only one scientist who gave evidence in their inquiry who was independent of industry, and that was Dr Cherry from New Zealand. That is my reputation around Europe and the University of Canterbury gave me a royal honour, a scholarship honour – a Golden Key Award for expressing the truth in science. This is an academic honour.”
Consultant for the World Bank During this period Neil was an academic consultant for the World Bank. He was asked to go to Kenya and assess the Kenya Meteorological Department’s seasonal forecasting.
Review of the U.S. Wind/Energy Survey Programme He was also asked to be the independent international reviewer of the U.S. Wind/Energy Survey Programme because he had been responsible for the New Zealand programme. He wondered what a Kiwi involved in a $NZ30,000 per year programme could do for a $US4.6,000,000 per year programme.
In June 1980 he and Gae went to the U.S. to Richland in Washington state to the Patel Pacific Northwest Laboratories, down wind of Mt St Helens, shortly after the Mt St Helens eruption in May of that year, and saw the ash from the eruption – a fascinating experience.
His first question was “Who checks the exposure of the anemometers?” There was no comment on that in their review reports.
The reply was “Why are you asking that question? We didn’t need to do that because all the data are from airports.”
“But,” said Neil, “I have looked at the time series data, and they show big changes over time. Something must have happened in 1962. Prior to that date the wind speeds in the U.S. were going down quite significantly at most of the sites, but went up in 1961-2, and then slowly went down after that, so I reckon that you have got tree growth and urban growth prior to 1961 and 1962. They then moved the animometers from the control tower to the runway (i.e. to a more open area) and the wind speeds went up. Then buildings went up around the airports themselves and the wind speeds went down.”
Neil was directed to go to Ashville, North Carolina, and ask them what happened in 1961-2 and see if his claim was correct. His investigations there proved that it was exactly what had happened. In many of the airports they had a progressive reduction of wind speeds over the next ten or twenty years after 1962, so Neil’s philosophy was that wind data are the best indication of the environment. The patterns tell the researcher what has happened.
In New Zealand almost every site has been visited. The local people have been interviewed about what has happened in the last forty or so years, and the patterns have been evident in the data.
The next step was to work out a technique to calculate the effect on wind speed of local trees and buildings and roughness in the ground and adjust the data to that of an open site. Much time was spent cleaning up the New Zealand data to represent open sites, the type on which wind farms could be built, Because the Americans had assumed that their data was from an open site they had not done that and as a result they had greatly underestimated their wind resource. Reviewing their programme Neil had found some major shortcomings, but was able to fix them. It amazed Neil that the most sophisticated programme in the world had made assumptions that were not justified. The U.S. scientists were really appreciative of what he had been able to do because of the down to earth practical New Zealand experience, and asked him to do more and more, including being co-author of The Wind Survey of the World with Dennis Elliott.
Doing more and more meant learning more and more with much more data because every nuclear power station in the US is required to have a weather station with a tall mast to measure the wind profile and the temperature profile so that when airborne krypton is released it goes away from where people live. This meant that Neil was able to refine the adjustment techniques developed in New Zealand, show that they worked in the U.S. and Europe, and include them in The Wind Survey of the World.
Wind and solar energy survey in Sri Lanka The Dutch government had undertaken an aid programme to provide a wind and solar energy survey in Sri Lanka. Holland does not have any hills, so they looked for a consultant with experience of wind surveys in hilly areas and approached Neil to assist with the design of the programme.
Health effects of air pollution and other environmental contaminants Neil’s initial involvement in this area was in Montreal, then Auckland and then Christchurch. He has supervised two Masters students working on Christchurch’s air pollution problems and their solutions.
“To assist with that we now always say, ‘You need to be in touch with world experts,'”said Neil. “Through that process I and my students have been in touch with the British experts like Professor Anthony Seaton at the University of Aberdeen. He is chair of the British Air Quality Health Standards Committee. Through telephone contact and visits we have kept in touch with the Victorian Environmental Protection Authority in Australia and the U.S. Environmental Protection Agency to ensure that we have the latest data for our research.”
For more information about Neil Cherry’s scientific research go to his website www.neilcherry.com
Return to the index of Neil Cherry’s life story.


